Figures and Charts of the Strategic Business Units
Overview Strategic Business Units
Earnings, EBIT, investments and employees 2008 - 2010
Earnings 2008-2010 by business units
[in CHF million]
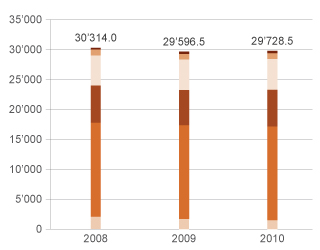
| Total 2008 | 30'314.0 |
|---|---|
| Other | 392.0 |
| Financial Services | 1`022.5 |
| Industry & Wholesaling | 4`967.8 |
| Commerce | 6`213.2 |
| Cooperative Retailing | 15`777.1 |
| Travel | 1`941.4 |
| Total 2009 | 29'596.5 |
|---|---|
| Other | 385.8 |
| Financial Services | 992.9 |
| Industry & Wholesaling | 5`021.8 |
| Commerce | 5`869.7 |
| Cooperative Retailing | 15`695.2 |
| Travel | 1`631.1 |
| Total 2010 | 29'728.5 |
|---|---|
| Other | 351.5 |
| Financial Services | 967.4 |
| Industry & Wholesaling | 5`128.8 |
| Commerce | 6`092.9 |
| Cooperative Retailing | 15`683.2 |
| Travel | 1`504.7 |
EBIT 2008-2010 by business units
[in CHF million]
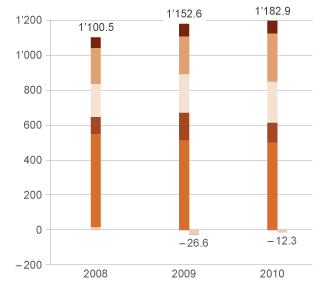
| Total 2008 | 1'100.5 |
|---|---|
| Other | 61.2 |
| Financial Services | 207.5 |
| Industry & Wholesaling | 186.5 |
| Commerce | 98.7 |
| Cooperative Retailing | 532.6 |
| Travel | 14.0 |
| Total 2009 | 1'152.6 |
|---|---|
| Other | 73.3 |
| Financial Services | 216.7 |
| Industry & Wholesaling | 218.1 |
| Commerce | 156.4 |
| Cooperative Retailing | 514.7 |
| Travel | -26.6 |
| Total 2010 | 1'182.9 |
|---|---|
| Other | 70.9 |
| Financial Services | 277.5 |
| Industry & Wholesaling | 232.9 |
| Commerce | 112.3 |
| Cooperative Retailing | 501.6 |
| Travel | -12.3 |
Investments 2008-2010 by business units
[in CHF million]
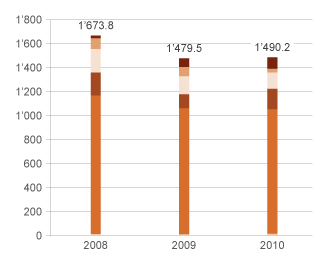
| Total 2008 | 1'673.8 |
|---|---|
| Other | 24.4 |
| Financial Services | 93.4 |
| Industry & Wholesaling | 193.9 |
| Commerce | 189.9 |
| Cooperative Retailing | 1`157 |
| Travel | 15.2 |
| Total 2009 | 1'479.5 |
|---|---|
| Other | 71.1 |
| Financial Services | 76.8 |
| Industry & Wholesaling | 150.7 |
| Commerce | 117.8 |
| Cooperative Retailing | 1`050.7 |
| Travel | 12.4 |
| Total 2010 | 1'490.2 |
|---|---|
| Other | 96.5 |
| Financial Services | 31.5 |
| Industry & Wholesaling | 135.3 |
| Commerce | 171.3 |
| Cooperative Retailing | 1`039.5 |
| Travel | 16.1 |
Workforce 2008-2010 by business units
[in thousands]
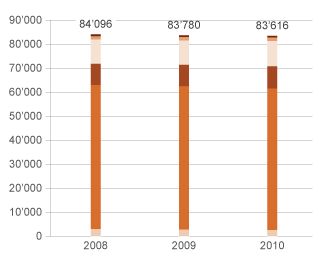
| Total 2008 | 84'096 |
|---|---|
| Other | 768 |
| Financial Services | 1'424.0 |
| Industry & Wholesaling | 9'955.0 |
| Commerce | 8'896.0 |
| Cooperative Retailing | 60'165.0 |
| Travel | 2'888.0 |
| Total 2009 | 83'780 |
|---|---|
| Other | 763.0 |
| Financial Services | 1'493.0 |
| Industry & Wholesaling | 10'049.0 |
| Commerce | 9'024.0 |
| Cooperative Retailing | 59'786.0 |
| Travel | 2'665.0 |
| Total 2010 | 83'616 |
|---|---|
| Other | 697.0 |
| Financial Services | 1'537.0 |
| Industry & Wholesaling | 10'523.0 |
| Commerce | 9'235.0 |
| Cooperative Retailing | 59'057.0 |
| Travel | 2'567.0 |
Migros Group sales
Migros Group sales
| in CHF million | 2010 | 2009 | Change in % |
| Net revenue from goods and services sold by segment | |||
| Cooperative Retailing | |||
| Cooperatives incl. foreign retail sales1 | 15'164.2 | 15'221.8 | –0.4 |
| FCM | 5'364.4 | 5'414.2 | –0.9 |
| Logistics | 329.0 | 336.0 | –2.1 |
| Other companies | 128.1 | 111.5 | 14.9 |
| Commerce | |||
| Denner1 | 2'783.7 | 2'763.0 | 0.7 |
| Migrol1 | 1'703.9 | 1'564.0 | 8.9 |
| Magazine zum Globus1 | 818.1 | 795.5 | 2.8 |
| Interio1 | 257.3 | 261.8 | –1.7 |
| Ex Libris1 | 190.5 | 193.2 | –1.4 |
| LeShop1 | 151.2 | 131.5 | 15.0 |
| Office World and Others1 | 130.9 | 106.5 | 22.9 |
| Other companies1 tlw | 41.5 | 31.5 | 31.6 |
| Industry & Wholesaling | 5'315.8 | 5'186.0 | 2.5 |
| Travel | 1'489.3 | 1'618.0 | –8.0 |
| Financial Services | 3.7 | 3.4 | 8.8 |
| Other | 329.3 | 360.2 | –8.6 |
| Total net revenue from goods and services sold | 34'200.7 | 34'098.1 | 0.3 |
| Elimination of internal Group sales of goods and services | –10'391.0 | –10'397.0 | –0.1 |
| TOTAL NET REVENUE FROM GOODS AND SERVICES SOLD | 23'809.7 | 23'701.1 | 0.5 |
| Income from Financial Services | 960.2 | 989.4 | –3.0 |
| Other operating income | 270.7 | 257.3 | 5.2 |
| Elimination of internal Group income | –0.3 | -0.9 | –62.5 |
| Total income (sales) | 25'040.3 | 24'946.9 | 0.4 |
1 Migros retail sales CHF 21'199.8 million (previous year CHF 21'037.2 million), of which foreign retail sales CHF 201.3 million (previous year CHF 204.1 million) by Migros France and Migros Germany.
Market shares
Market shares 2007–2010
(in %)
| 2007 | 2008 | 2009 | 2010 | |
| Market share – Food | 25.0 | 28.6 | 28.1 | 27.3 |
| Market share – Non-Food | 12.4 | 12.9 | 13.0 | 13.0 |
| Market share – Migros Group | 18.3 | 20.6 | 20.4 | 20.1 |
The Migros Group's revenue remained at around CHF 19.6 billion, representing a slight reduction in market share by 0.3%.
In the Food area, the Migros Group's sales were also stable at around CHF 13.2 billion, representing a 0.8% reduction in market share for the total market, which was 2.2% larger than in the previous year. Migros organic products performed well; sales in this area rose by 14% on the same period of the previous year. The market share in the Non-Food area remained at the previous year's level, with sales rising by 1% to 13.0%. Specialist markets' revenue, up by 1.4%, developed particularly well, despite negative inflation of 3.0% within Migros. Overall in 2010, Migros was once again able to report higher sales volumes than for the previous year.
Denner (+1.1%), LeShop (+14.7%) and Herren Globus (+8.7%) all increased their revenues.
Net revenue from goods and services sold by region
Cooperative Retailing
Earnings
Earnings Cooperative Retailing
| in CHF million | 2010 | 2009 | Change in % |
| Net revenue from goods and services sold | |||
| – Cooperatives incl. other countries | 15'164.2 | 15'221.8 | –0.4 |
| – FMC | 5'364.4 | 5'414.2 | –0.9 |
| – Logistics | 329.0 | 336.0 | –2.1 |
| – Other companies | 128.1 | 111.5 | 14.9 |
| Total net revenue from sales of goods and services sold | 20'985.7 | 21'083.5 | –0.5 |
| Other operating income | 162.1 | 148.3 | 9.3 |
| Eliminations | –5'464.6 | –5'536.6 | –1.3 |
| Total income | 15'683.2 | 15'695.2 | –0.1 |
| Earnings before financial income, income tax and pension plan effect (EBIT) | 501.6 | 514.7 | –2.5 |
| Segment assets | 8'863.1 | 8'637.5 | |
| Investments in long-term assets | 1'039.5 | 1'050.7 | |
| Employees | 59'057 | 59'786 |
Charts of the ten regional Cooperatives
Distribution network
Distribution network Cooperative Retailing
| No. of sites 2010 | No. of sites 2009 | Sales area (m2) 2010 | Sales area (m2) 2009 | |
| M DISTRIBUTION SITES SWITZERLAND | ||||
| Migros sites | ||||
| M | 291 | 292 | 214'364 | 206'998 |
| MM | 213 | 209 | 493'526 | 487'715 |
| MMM | 39 | 39 | 325'621 | 322'959 |
| TOTAL | 543 | 540 | 1'033'511 | 1'017'672 |
| MParcs/specialist market centres/Obi | 44 | 42 | 248'815 | 238'924 |
| Single-line stores (bargain basements, etc.) | 19 | 18 | 9'875 | 8'463 |
| TOTAL | 63 | 60 | 258'690 | 247'387 |
| Standalone restaurants | 4 | 4 | 1'003 | 1'003 |
| TOTAL SITES | 610 | 604 | 1'293'204 | 1'266'062 |
| M DISTRIBUTION LINES SWITZERLAND | ||||
| Supermarkets | ||||
| M, MM und MMM | 543 | 540 | 847'189 | 831'629 |
| Other supermarkets1 | 10 | 10 | 12'553 | 11'807 |
| TOTAL SUPERMARKETS | 553 | 550 | 859'742 | 843'436 |
| Specialist markets | ||||
| Do It+Garden | 50 | 51 | 107'793 | 106'513 |
| Micasa | 28 | 28 | 63'447 | 60'905 |
| sportXX | 53 | 50 | 61'492 | 55'007 |
| m-electronics | 65 | 62 | 32'109 | 31'131 |
| Obi DIY superstore/garden | 10 | 10 | 81'295 | 81'293 |
| TOTAL SPECIALIST MARKETS | 206 | 201 | 346'136 | 334'849 |
| Migros catering services | ||||
| M-Restaurants, standalone | 4 | 4 | 1'003 | 1'003 |
| M-Restaurants, in-store | 185 | 186 | 86'323 | 86'774 |
| TOTAL RESTAURANTS | 189 | 190 | 87'326 | 87'777 |
| M DISTRIBUTION SITES OTHER COUNTRIES | ||||
| France (Migros France) | ||||
| MMM | 2 | 2 | 10'069 | 10'400 |
| MM | 1 | 1 | 1'317 | 1'350 |
| Germany (GM Basel) | ||||
| MM | 4 | 3 | 8'931 | 7'173 |
| TOTAL OTHER COUNTRIES | 7 | 6 | 20'317 | 18'923 |
| WHOLESALING - COOPERATIVES AND OTHER | ||||
| Migros Partner | 75 | 84 | ||
| VOI | 8 | 6 | ||
| LEISURE FACILITIES AND FOUNDATIONS | ||||
| Fitnessparks, fitness centres and Wellnessparks2 | 40 | 37 | ||
| Aquaparks | 3 | 2 | ||
| Sportparks | 3 | 3 | ||
| Golfparks | 6 | 6 | ||
| Green Meadow Parks Foundation | 4 | 4 |
1 Integral with MParcs or specialist market centers.
2 Incl. subsidiaries (Activ Fitness, FlowerPower, TC Innerschweiz).
Commerce
Earnings
Earnings Commerce
| in CHF million | 2010 | 2009 | Change in % |
| Net revenue from goods and services sold | |||
| – Denner | 2'783.7 | 2'763.0 | 0.7 |
| – Migrol | 1'703.9 | 1'564.0 | 8.9 |
| – Magazine zum Globus | 818.1 | 795.5 | 2.8 |
| – Interio | 257.3 | 261.8 | –1.7 |
| – Ex Libris | 190.5 | 193.2 | –1.4 |
| – LeShop | 151.2 | 131.5 | 15.0 |
| – Office World | 130.9 | 106.5 | 22.9 |
| – Other companies | 41.5 | 31.5 | 31.6 |
| Total net revenue from sales of goods and services sold | 6'077.0 | 5'847.0 | 3.9 |
| Other operating income | 45.3 | 48.5 | –6.6 |
| Eliminations | –29.4 | –25.8 | 14.0 |
| Total income (sales) | 6'092.9 | 5'869.7 | 3.8 |
| Earnings before financial income, income tax and pension plan effect (EBIT) | 112.3 | 156.4 | –28.2 |
| Segment assets | 1'996.4 | 1'839.8 | |
| Investments in long-term assets | 171.3 | 117.8 | |
| Employees | 9'235 | 9'024 |
Distribution network
Distribution network Commerce
| No. of sites 2010 | No. of sites 2009 | Sales area (m2) 2010 | Sales area (m2) 2009 | |
| Denner | 761 | 752 | ||
| Denner stores | 441 | 437 | 170'035 | 165'954 |
| Denner Satellite stores | 320 | 315 | ||
| Globus (Magazine zum Globus AG) | 39 | 37 | 110'200 | 101'700 |
| Globus department stores | 15 | 14 | 96'700 | 89'500 |
| Herren Globus | 24 | 23 | 13'500 | 12'200 |
| Interio (incl. Depot-Interio Boutiques) | 30 | 21 | 42'442 | 40'229 |
| Office World | 22 | 21 | 14'567 | 14'355 |
| Ex Libris | 114 | 118 | 11'010 | 11'100 |
| MIGROL | ||||
| Filling stations, total | 295 | 306 | ||
| Migrol Auto Service/Migrol Service1 | 149 | 183 | ||
| Filling stations (automat)1 | 146 | 123 | ||
| Convenience Stores (migrolino, Migrol Shops and avec) | (138) | (143) | ||
| Convenience Stores | 225 | 217 | ||
| migrolino2 | 160 | 136 | ||
| Migrol Shops3 | 65 | 79 | ||
| avec4 | 0 | 2 |
1 Adjustments to the format descriptions (figures only marginally comparable to previous year).
2 Operated by Migrol, Shell or migrolino AG.
3 Partly renamed in migrolino.
4 The avec Shops were all renamed to migrolino in 2010.
Industry & Wholesaling
Earnings
Earnings Industry & Wholesaling
| in CHF million | 2010 | 2009 | Change in % |
| Net revenue from goods and services sold | 5'315.8 | 5'186.0 | 2.5 |
| Other operating income | 40.7 | 37.8 | 7.7 |
| Eliminations | –227.7 | –202.0 | 12.7 |
| Total income | 5'128.8 | 5'021.8 | 2.1 |
| Earnings before financial income, income tax and pension plan effect (EBIT) | 232.9 | 218.1 | 6.8 |
| Segment assets | 1'985.3 | 2'009.3 | |
| Investments in long-term assets | 135.3 | 150.7 | |
| Employees | 10'523 | 10'049 |
Charts of Industry & Wholesaling
Financial Services
Earnings
Earnings Financial Services
| in CHF million | 2010 | 2009 | Change in % |
| Net revenue from goods and services sold | 3.7 | 3.4 | 8.8 |
| Income from financial services | 960.2 | 989.4 | –3.0 |
| Other operating income | 3.5 | 0.1 | n.a. |
| Total income | 967.4 | 992.9 | –2.6 |
| Earnings before finance income, income tax and pension plan effect (EBIT) | 277.5 | 216.7 | 28.1 |
| Segment assets | 33'663.6 | 32'607.8 | |
| Investments in long-term assets | 31.5 | 76.8 | |
| Employees | 1'537 | 1'493 |
Travel
Earnings
Earnings Travel
| in CHF million | 2010 | 2009 | Change in % |
| Net revenue from goods and services sold | 1'489.3 | 1'618.0 | –8.0 |
| Other operating income | 15.5 | 13.1 | 18.3 |
| Total income | 1'504.7 | 1'631.1 | –7.7 |
| Earnings before finance income, income tax and pension plan effect (EBIT) | –12.3 | –26.6 | |
| Segment assets | 153.1 | 109.3 | |
| Investments in long-term assets | 16.1 | 12.4 | |
| Employees | 2'567 | 2'665 |