Figures and Charts of Our Responsibility
Sustainable consumption
Charts on the sustainable labels
2'0182'149
20092010
05001000150020002500
Total sales of sustainable labels
[in CHF millions]
746.0 (+7.3%)600.0 (-6.7%)407.0 (+14.0%)173.0 (+21.7%)82.0 (+4.0%)50.0 (+30.6%)39.0 (+158.6%)35.0 (+0.5%)18.0 (+30.8%)
AdRTerraSuisseMigros BioFSCMax HavelaarMSCToptenClimatopBio Cotton
02004006008001000
Sales of individual labels 2010
[in CHF millions]
Figures on the production conditions
Implementation of BSCI Code of Conduct 2009 -2010 (figures estimated)
Non-Food 2009 | Non-Food 2010 | Food + Fresh Product 2009 | Food + Fresh Product 2010 | |
Codex signed | 92% | 95% | 75% | 90% |
Self-assessments | 133 | 75 | 6 | 9 |
Audits (+reaudits) | 186 | 180 | 5 | 10 |
Environmental protection
Key energy figures
1'6461'6251'6271'6271'630
20062007200820092010
0200400600800100012001400160018002000
Total energy consumption, absolute
[in GWh]
- Electricity
- Heat
- Fuels
107.6103.399.199.899.5
20062007200820092010
020406080100120
Total energy consumption, specific
[in kWh/1,000 francs in sales]
- Electricity
- Heat
- Fuels
326322306309309
241244236242246
20062007200820092010
050100150200250300350400
Specific energy consumption of industrial companies
[in kWh/t of production]
- Heat
- Electricity
9882827573
408409402397388
20062007200820092010
050100150200250300350400450500
Specific energy consumption of stores
[in kWh/m2 of sales space]
- Heat
- Electricity
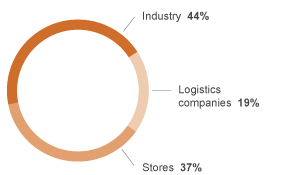
Share of business units in total energy consumption
Key climate figures and refrigeration systems
136128182178173
20062007200820092010
020406080100120140160180200
Total direct greenhouse gas emissions (GHG), absolute
[in tonnes of CO2eq (as defined in the Greenhouse Gas Protocol, Scope)]
- CO2eq refrigerant emissions
- CO2 fuels
- CO2 combustibles
8.98.211.110.910.6
20062007200820092010
012345678910111213
Total direct greenhouse gas emissions (GHG), specific
[in kg of CO2-eq/1,000 francs in sales]
- CO2eq refrigerant emissions
- CO2 fuels
- CO2 combustibles
Share of business units in the total directly caused THG
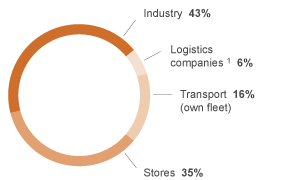
132357100153
20062007200820092010
020406080100120140160180
CO2 cooling and refrigeration systems in Migros stores
[number of systems]
- Freezer systems
- Chiller systems
82.179.678.476.672.8
80.9
2006200720082009201020112012
60708090100
CO2 target agreement with EnAW: Migros
[CO2-Intensity in per cent]
2004 2006 2008 2010 2012
5060708090100110
CO2 target agreement with EnAW: operating centres
[CO2-Intensity1 in per cent]
- CO2 trend, operations centres(combustibles)
- CO2 target, operations centres(combustibles)
- CO2 trend, operations centres (fuels)
- CO2 target, operations centres (fuels)
2000 2002 2004 2006 2008 2010 2012
5060708090100110
CO2 target agreement with EnAW: points-of-sales and industrial companies
[CO2-Intensity1 in per cent]
- CO2 trend, operations centres(combustibles)
- CO2 target, operations centres(combustibles)
- CO2 trend, operations centres (fuels)
- CO2 target, operations centres (fuels)
Key transport figures
206187169144126
20062007200820092010
050100150200250
Nitrogen oxide emissions lorries (own fleet)
[in tonnes]
4.43.93.52.92.5
20062007200820092010
012345
Particulate emissions (own fleet)
[in tonnes]
10.19.410.110.310.6
20062007200820092010
024681012
Kilometres travelled using rail transport
[in millions of km]
3131303130
20062007200820092010
05101520253035
Kilometres travelled by lorries by Euro class (own fleet)
[in millions of km]
- Euro 0, 1, 2, 3
- Euro 4+5
Disposal and water figures
200198197202208
20062007200820092010
050100150200250
Operational waste, total
[in 1,000 tonnes]
- Stores, Logistics companies and FMC
- Industry
13.112.612.012.412.7
20062007200820092010
02468101214
Operational waste, specific
[in kg/1,000 francs in sales]
Components of operational waste
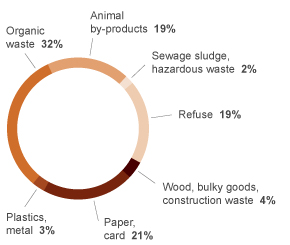
62.365.667.268.269.5
20062007200820092010
01020304050607080
Recycling rate operational waste
[in per cent]
12.512.912.612.913.0
20062007200820092010
0246810121416
Customer returns by type
[in 1,000 tonnes]
- Batteries
- Electronic scrap
- PE dairy product bottles
- PET
8.17.77.47.57.5
20062007200820092010
0123456789
Water consumption, absolute
[in million cubic metres]
- Logistics companies
- Industry
- Stores
0.530.490.460.460.46
20062007200820092010
0.400.420.440.460.480.500.520.540.560.58
Water consumption, specific
[in million cubic metres]
Migros Culture Percentage
Migros Culture Percentage key figures
116127120114115
20062007200820092010
020406080100120140
Migros Culture Percentage expenditure
[in CHF millions]
Breakdown of expenses of Migros Culture Percentage by area 2010
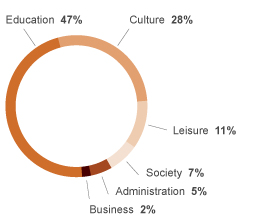
Migros Culture Percentage expenditure 1957 - 2010
Dialogue
Dialogue key figures
Number of M-infoline customer enquiries (in thousand)
2006 | 2007 | 2008 | 2009 | 2010 | |
Enquiries | 118 | 145 | 159 | 150 | 165 |
Number of Migros-Magazin readers (in thousand)
2006 | 2007 | 2008 | 2009 | 2010 | |
Circulation | 2'291 | 2'215 | 2'191 | 2'176 | 2'156 |
Readers | 3'035 | 3'028 | 2'988 | 3'074 | 3'013 |