Figures and Charts of Our Responsibility
Sustainable consumption
Figures on sustainable labels
CHART - Gesamtumsatz nachhaltige Labels
CHART – Umsätze der einzelnen Labels 2010
2 Due to new calculation bases, the sales of the sustainable labels are available for the first time as of 2009.
Figures on production conditions
CHART - Ergebnisse BSCI-Audits (Erstaudits und Folgeaudits)
Environmental protection
Key figures energy and climate
Cooperative Retailing and Industry
CHART - CO2-Zielvereinbarung Migros
CHART - CO2-Zielvereinbarung EnAW: Betriebszentralen
CHART - CO2-Zielvereinbarung ENAW: Filialen und Industriebetriebe
CHART – Gesamtenergieverbrauch, absolut
CHART – Gesamtenergieverbrauch, spezifisch
Total energy consumption, absolute 2011 [in GWh]
| Electricity | Heat | Fuel1 | TOTAL | ||
| Cooperative Retailing | 650 | 132 | 108 | 890 | |
| Stores | 506 | 74 | 581 | 36% | |
| Logistics companies (operations centres, distribution units, FMC) | 144 | 58 | 108 | 310 | 19% |
| Industry | 320 | 383 | 6 | 709 | 44% |
| SUM | 970 | 515 | 114 | 1'600 | |
| 61% | 32% | 7% |
CHART – Spezifischer Energieverbrauch der Industriebetriebe
CHART – Spezifischer Energieverbrauch der Filialen
Proportion of energy carriers in total energy consumption
[in per cent] Total consumption: 1'600 GWh
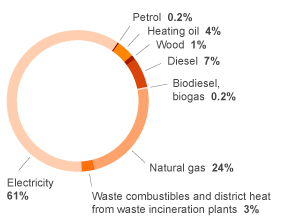
CHART - Gesamte direkt verursachte Treibhausgasemissionen (THG), absolut
CHART – Gesamte direkt verursachte Treibhausgasemissionen (THG), spezifisch
Direct und indirect greenhouse gas emissions (GHG) 2011 Scope 1, 2 and 36, absolute [in tonnes CO2eq]
| SCOPE 1: direct GHG emissions | SCOPE 2: indirect GHG emissions | SCOPE 3: other indirect GHG emissions | ||||||
| Heat8 | Fuel1 | Refrigerant emissions | Electricity5 | TOTAL (Scope 1,2) | Operational waste9 | Passanger flights10 | TOTAL (Scope 1,2,3) | |
| Cooperative Retailing | 186'609 | 209'035 | ||||||
| Stores | 15'968 | 35'230 | 77'974 | 21'100 | 64 | |||
| Logistics companies7 | 6'982 | 27'703 | 634 | 22'118 | 1'262 | |||
| Industry | 68'586 | 1'695 | 3'963 | 49'268 | 123'512 | 6'800 | 933 | 131'245 |
| TOTAL | 91'536 | 29'398 | 39'827 | 149'360 | 310'120 | 27'900 | 2'259 | 340'280 |
| 27% | 9% | 12% | 44% | 8% | 1% | |||
CHART - CO2-Kälteanlagen in den Migros-Filialen
1 In-house car fleets Migros cooperatives+Scana
2 Income Migros retail (Migros cooperatives, FMC, industrial and logistics enterprises)
3 Greenhouse gas emissions Scope 1 and 2 in accordance with Greenhouse Gas Protocol
4 Fuel consumption of in-house vehicle fleets of the Migros cooperatives and Scana
5 In accordance with Swiss consumption mix at 154g CO2eq/kWh power
6 Greenhouse gas emissions Scope 1 , 2 and 3 in accordance with Greenhouse Gas Protocol
7 Operating centres, distribution units and FMC
8 Incl. emissions from district heat (scope 2)
9 Calculation based on 2010 emission factors of Swiss greenhouse gas statistics; in industrial production, less rubbish but mainly CO2-neutral organic waste is generated.
10 Business flights of employees; offsetting via myclimate
Key transport figures
Cooperative Retailing and Industry
CHART – Stickoxidemissionen LKW
CHART – Feinstaubemissionen
CHART – Kilometerleistung Bahntransporte
CHART – Kilometerleistung Lastwagen nach Eurokategorie
1 In-house car fleets Migros cooperatives+Scana
Key disposal figures
Cooperative Retailing and Industry
CHART – Betriebsabfälle, total
CHART – Betriebsabfälle, spezifisch
Components of operational waste

Disposal processes operating waste
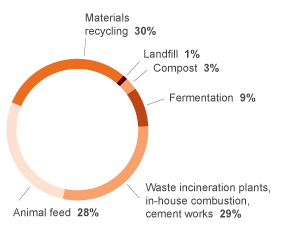
CHART – Verwertungsquote Betriebsabfall
CHART - EBIT
1 Income Migros retail (Migros cooperatives, FMC, industrial and logistics enterprises)
2 Materials recycling, animal feed, fermentation, compost, without thermal utilisation (combustion)
Key water figures
Cooperative Retailing and Industry
CHART – Wasserverbrauch, absolut
CHART - Wasserverbrauch, spezifisch
1 Income Migros retail (Migros cooperatives, FMC, industrial and logistics enterprises)
Society
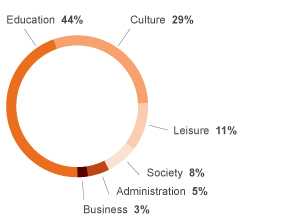
Migros Culture Percentage key figures
CHART - Ausgaben Migros-Kulturprozent
Breakdown of expenses of Migros Culture Percentage by area 2011
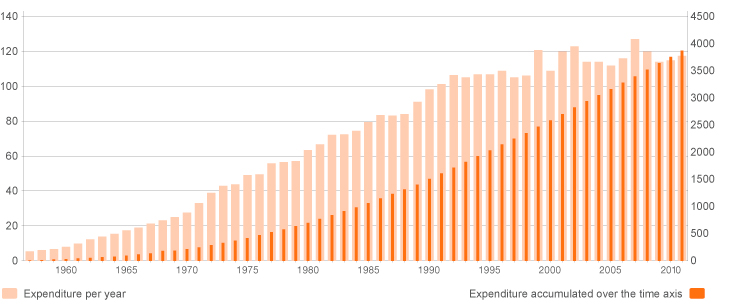
Migros Culture Percentage expenditure 1957 - 2011
Dialogue key figures
Number of M-infoline customer enquiries (in thousand)
| 2007 | 2008 | 2009 | 2010 | 2011 | |
| Enquiries | 145 | 159 | 150 | 165 | 167 |
Number of Migros-Magazin readers (in thousand)
| 2007 | 2008 | 2009 | 2010 | 2011 | |
| Circulation | 2'215 | 2'191 | 2'176 | 2'156 | 2'163 |
| Readers | 3'028 | 2'988 | 3'074 | 3'013 | 3'066 |