Figures and Charts of Our Responsibility
Sustainable consumption
Sustainable range and labels key figures
CHART - Gesamtumsatz nachhaltige Labels
CHART – Umsätze der einzelnen Labels 2010
2 Due to new calculation bases, the sales of the sustainable labels are available for the first time as of 2009.
3 New since 2011
4 The ASC label was launched in 2011.
Production conditions key figures
CHART - Ergebnisse BSCI-Audits (Erstaudits und Folgeaudits)
Environment
Energy and climate key figures
Migros Group
Direct und indirect greenhouse gas emissions (GHG) 2012 Scope 1, 2 and 31, absolute
[in tonnes CO2eq]
| Direct GHG emissions (Scope 1) | Indirect GHG emissions (Scope 2) | TOTAL (Scope 1,2) | Other indirect GHG emissions (Scope 3) | TOTAL (Scope 1,2,3) | ||||
| Heat | Fuel5 | Refrigerants | Electricity6 | Operational waste7 | Passenger flights8 | |||
| Cooperative Retailing | 22'509 | 27'281 | 38'246 | 99'605 | 187'640 | 20'800 | 210'068 | |
| Stores | 15'139 | 37'117 | 77'431 | 129'687 | 41 | |||
| Logistics companies2 | 7'370 | 27'281 | 1'128 | 22'174 | 57'953 | 1'588 | ||
| Industry | 67'178 | 1'576 | 2'083 | 48'726 | 119'563 | 7'200 | 1'268 | 128'031 |
| Cooperative Retailing + Industry | 89'687 | 28'857 | 40'329 | 148'331 | 307'203 | 28'000 | 2'896 | 338'099 |
| Commerce3 | 6'055 | 1'197 | 18'880 | 26'132 | ||||
| Financial Services and Travel4 | 265 | 1'545 | 1'810 | |||||
| Leisure Facilities (Fitnessparks) | 3'567 | 3'505 | 7'073 | |||||
| TOTAL | 99'576 | 28'857 | 41'525 | 172'261 | 342'218 | |||
Total energy consumption, absolute 2012
[in GWh]
| Electricity | Heat | Fuel5 | TOTAL | |
| Cooperative Retailing | 647 | 133 | 106 | 886 |
| Stores | 503 | 73 | 576 | |
| Logistics companies2 | 144 | 60 | 106 | 310 |
| Industry | 316 | 380 | 6 | 703 |
| Cooperative Retailing + Industry | 963 | 513 | 112 | 1'588 |
| Commerce3 | 123 | 28 | 151 | |
| Financial Services and Travel4 | 10 | 1 | 11 | |
| Leisure Facilities (Fitnessparks) | 23 | 24 | 47 | |
| TOTAL | 1'119 | 567 | 112 | 1'797 |
CHART - Minergie-zertifizierte Fläche
1 Scope of greenhouse gas emissions according to Greenhouse Gas Protocol
2 Operating centres, distribution units and FMC
3 Based on data of retailers Globus, Interio, Migrol and Denner (contains some projections)
4 Based on data of Migros Bank and Hotelplan Switzerland
5 Own vehicle fleets of the Migros Cooperatives and Scana
6 In accordance with Swiss consumption mix at 154g CO2eq/kWh power
7 Calculation based on 2010 emission factors of Swiss greenhouse gas statistics; in industrial production, less rubbish but mainly CO2-neutral organic waste is generated.
8 Business flights of employees; offsetting via myclimate
9 Increase in the Minergie-certified area from 2010 to 2011 due in part to a more comprehensive survey and reconciliation with the Minergie association
Cooperative Retailing and Industry
CHART - CO2-Zielvereinbarung Migros
CHART - CO2-Zielvereinbarung EnAW: Betriebszentralen
CHART - CO2-Zielvereinbarung ENAW: Filialen und Industriebetriebe
CHART - Gesamte direkt verursachte Treibhausgasemissionen (THG), absolut
CHART – Gesamte direkt verursachte Treibhausgasemissionen (THG), spezifisch
CHART - CO2-Kälteanlagen in den Migros-Filialen
CHART – Füllmenge H-FCKW
CHART – Gesamtenergieverbrauch, absolut
CHART – Gesamtenergieverbrauch, spezifisch
CHART – Spezifischer Energieverbrauch der Industriebetriebe
CHART – Spezifischer Energieverbrauch der Filialen
Proportion of energy carriers in total energy consumption
Total consumption: 1'589 GWh
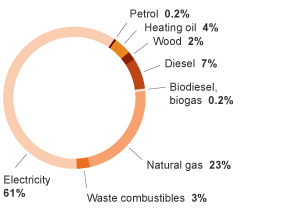
CHART - Anteil erneuerbare Wärme
1 Income from Migros Cooperative Retailing and Industry (Migros Cooperatives, FMC, industrial and logistics companies)
2 Operating centres, distribution units and FMC
3 Scope of greenhouse gas emissions according to Greenhouse Gas Protocol
4 Own vehicle fleets of the Migros Cooperatives and Scana
5 In accordance with Swiss consumption mix at 154g CO2eq/kWh power
Transport and mobility key figures
Cooperative Retailing and Industry
CHART – Kilometerleistung Bahntransporte
CHART – Kilometerleistung Lastwagen nach Eurokategorie
CHART – Stickoxidemissionen LKW
CHART – Feinstaubemissionen
1 Own vehicle fleets of the Migros Cooperatives and Scana
Waste and recycling key figures
Cooperative Retailing and Industry
CHART – Betriebsabfälle, total
CHART – Betriebsabfälle, spezifisch
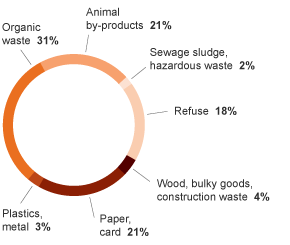
Components of operational waste
Disposal processes operating waste
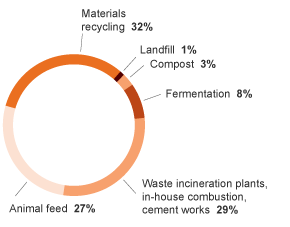
CHART – Verwertungsquote Betriebsabfall
CHART - EBIT
1 Income from Migros Cooperative Retailing and Industry (Migros Cooperatives, FMC, industrial and logistics companies)
2 Materials recycling, animal feed, fermentation, compost, without thermal utilisation (combustion)
Water key figures
Cooperative Retailing and Industry
CHART – Wasserverbrauch, absolut
CHART - Wasserverbrauch, spezifisch
1 Income from Migros Cooperative Retailing and Industry (Migros Cooperatives, FMC, industrial and logistics companies)
Society
Migros Culture Percentage key figures
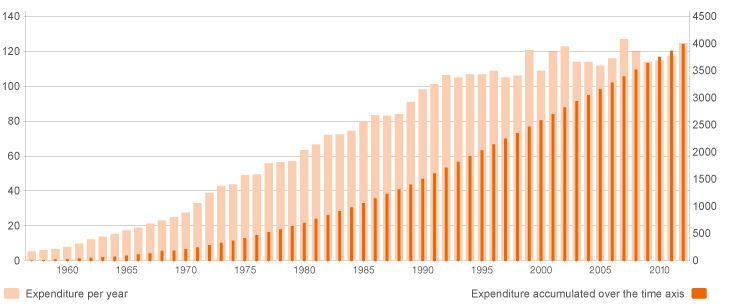
CHART - Ausgaben Migros-Kulturprozent
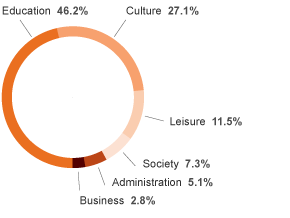
Breakdown of expenses of Migros Culture Percentage by area 2012
Migros Culture Percentage expenditure 1957 - 2012
Dialogue key figures
Number of M-Infoline customer enquiries (in thousand)
| 2008 | 2009 | 2010 | 2011 | 2012 | |
| Enquiries | 159 | 150 | 165 | 167 | 167 |
Number of Migros-Magazin readers (in thousand)
| 2008 | 2009 | 2010 | 2011 | 2012 | |
| Circulation | 2'191 | 2'176 | 2'156 | 2'163 | 2'160 |
| Readers | 2'988 | 3'074 | 3'013 | 3'066 | 3'107 |