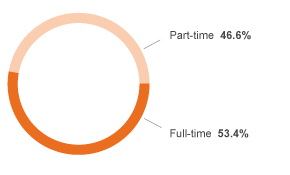
M10
Figures and Charts of Collaborators
Human resource management
Workforce and staff movements
82'71284'09683'78083'61686'393
61'46362'41261'73461'61563'462
20072008200920102011
020000400006000080000100000
Workforce Migros Group
- Persons
- Full-time positions
17.815.312.411.012.6
20072008200920102011
02468101214161820
Hiring rate
[in %]
57'55412'30510'6791'5702'5271'758
Cooperative retailCommerceIndustry & wholesaleFinancial servicesTravelOther companies
010000200003000040000500006000070000
Workforce by strategic business units
7.37.15.45.56.0
13.513.912.711.812.9
20072008200920102011
0246810121416
Fluctuation rate
[in %]
- Net staff turnover
- Gross staff turnover
13.8
13.0
1112131415
Hiring and fluctuation rates compared
[in %]
- Average accession rate for the past 5 years
- Average gross staff turnover for the past 5 years
Gender structure
TotalCooperative retailCommerceIndustry & wholesaleFinancial servicesTravelOther companies
0102030405060708090100
Number of employees by gender (in %)
- Women
- Men
- Female employment rate
Employment structure
Employment level
Full-time CHFull-time MigrosPart-time CHPart-time Migros
020406080100
Full- and part-time employment by gender (Migros/Switzerland)
[in %]
- Men
- Women
21.263.0
12.558.0
MenWomen
010203040506070
Part-time employment ratio
[in %]
- Migros
- Switzerland
Age structure
Distribution by age groups
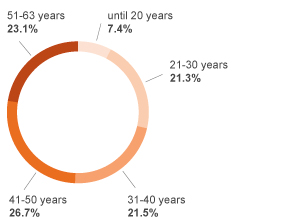
49.238.811.9
50.937.112.0
15-40 years old41-54 years old55-63 years old
0102030405060
Distribution by gender
[in %]
- Men
- Women
38.337.236.150.0
61.762.863.950.0
under 5 years old6 - 9 years old10 - 20 years oldover 20 years old
01020304050607080
Percentage per length of service group by gender
[in %]
- Migros Men
- Migros Women
40.918.721.618.8
42.720.524.712.1
under 5 years old6 - 9 years old10 - 20 years oldover 20 years old
010203040506070
Percentage within length of service group by gender
[in %]
- Migros Men
- Migros Women
Nationalities and nations
27.627.427.627.627.5
20072008200920102011
202530
Percentage of foreign workers
[in %]
Cooperative retailCommerceIndustry & wholesaleFinancial servicesTravelOther companies
0102030405060708090100
Employees in companies Switzerland/other countries (in %)
- Other companies
- Companies Switzerland
Work and health
Working hours, health and absences
119'385'642 h118'108'314 h
20102011
020406080100120
Working hours, holidays and absences
- Total working hours paid
- Paid leave and absences in %
- Actual working hours in %
95.595.3
20102011
9595.295.495.6
Wellness rating
[in %]
4.1
5.65.13.33.854.33.53.33.252.93.3
Agriculture and forestryConstructionPublic administrationPublic administrationTraffic and newsIndustry, energy and water supplyHospitality industryOther servicesCommerce, repair businessMigrosProperty, ITBanking and insurance industryPrivate households
0123456
Rate of absenteeism (in %)
1.6
1.41.22.11.41.41.51.82.11.61.42.21.3
Private householdsBanking and insurance industryProperty, ITMigrosCommerce, repair businessOther servicesHospitality industryIndustry, energy and water supplyTraffic and newsHealth and social carePublic administrationConstructionAgriculture and forestry
00.511.522.53
Duration of absences/job in weeks
Staff expenditure and value added
Wage development, personnel costs and value added
2.551.501.000.850.351.451.200.151.651.20
1.100.800.10-0.200.100.90-0.402.600.101.10
3.252.001.501.751.752.252.003.050.751.50
1.801.400.901.001.201.602.002.100.801.30
2002200320042005200620072008200920102011
-1-0.500.511.522.533.5
Wage adjustments
[in %]
- Real wages Migros
- Real wages economy as a whole
- Nominal wages Migros
- Nominal wages economy as a whole
4'653.44'901.44'931.74'934.95'038.5
20072008200920102011
4200430044004500460047004800490050005100
Personnel costs development
[in CHF million]
3'628.93'800.73'846.73'842.73'917.1
20072008200920102011
33503400345035003550360036503700375038003850390039504000
Wage bill development
[in CHF million]
6'311.56'617.56'708.16'658.36'487.1
20072008200920102011
58005900600061006200630064006500660067006800
Share of value added
[in CHF million]
Women, family and career
Work and gender
TotalCooperative retailCommerceIndustry & wholesaleFinancial servicesTravelOther companies
0102030405060708090100
Number of employees by gender (in %)
- Women
- Men
- Female employment rate 45%
Employment level
Full-time CHFull-time MigrosPart-time CHPart-time Migros
020406080100
Full- and part-time employment by gender (Migros/Switzerland)
[in %]
- Women
- Men
21.263.0
12.558.0
MenWomen
010203040506070
Full- and part-time employment by gender
[in %]
- Migros
- Switzerland
Distribution by age groups
49.238.811.9
50.937.112.0
15-40 years old41-54 years old55-63 years old
0102030405060
Part-time employment ratio
[in %]
- Men
- Women
40.918.721.618.8
42.720.524.712.1
under 5 years old6 - 9 years old10 - 20 years oldover 20 years old
010203040506070
Percentage within length of service group by gender
[in %]
- Migros Men
- Migros Women
38.337.236.150.0
61.762.863.950.0
under 5 years old6 - 9 years old10 - 20 years oldover 20 years old
01020304050607080
Percentage per length of service group by gender
[in %]
- Migros Men
- Migros Women
Women in managerial posts
23.123.824.725.325.9
8.89.69.812.514.6
20072008200920102011
051015202530
Women in managerial posts
[in %]
- Management
- Board
14.625.9
2.521.8
BoardManagement
051015202530
Women in managerial posts Migros/Switzerland
(Migros / Schweiz)
[in %]
- Migros
- Switzerland
Social Partnership/CLA
Participation
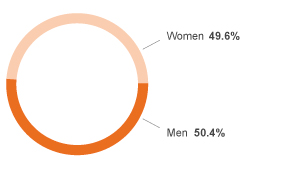
Gender distribution in personnel committees
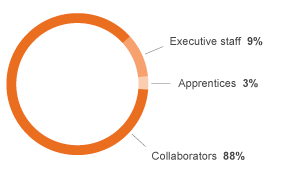
Functional position of the members in personnel committees
Subordination to collective labour agreements
69.8
35.9
Total collective
labour agreement MigrosTotal collective
labour agreement CH
labour agreement MigrosTotal collective
labour agreement CH
01020304050607080
Collective work agreement subordination Migros/Switzerland
[in %]
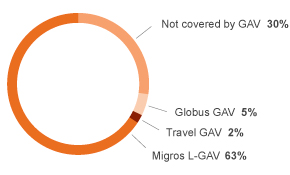
Subordination to collective work agreements in the Migros Group
Vacational training
Trainees at Migros
2'5912'7032'8962'8092'9573'1783'2643'3283'386
200320042005200620072008200920102011
05001000150020002500300035004000
Trainees at Migros
- Series 1
4.54.85.04.95.05.35.55.65.7
200320042005200620072008200920102011
01234567
Ratio of trainees
[in %]
- Apprentice rate Migros
2.987.58.93.664.3
9.779.60.020.475.0
4.447.60.052.480.0
4.182.810.86.455.5
4.891.25.73.159.5
6.482.415.42.262.0
Apprentice rateSwiss Federal Certificate of ProficiencyCertificateVocational diplomaContinued employment
0102030405060708090100
Vocational training by strategic business untis (in %)
- Other companies
- Travel
- Financial services
- Industry & wholesale
- Commerce
- Cooperative retail
5.783.013.04.062.0
Apprentice rateSwiss Federal Certificate of ProficiencyCertificateVocational diplomaContinued employment
0255075100
Vocational training in the Migros Group (in %)