Figures and Charts
of the Strategic Business Units
Overview Strategic Business Units
Earnings, EBIT, investments and employees 2008–2011
Earnings 2008-2011 by business units
[in CHF million]
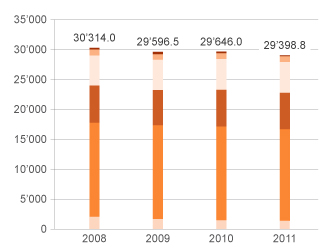
| Total 2008 | 30'314.0 |
|---|---|
| Other | 392.0 |
| Financial Services | 1`022.5 |
| Industry & Wholesaling | 4`967.8 |
| Commerce | 6`213.2 |
| Cooperative Retailing | 15`777.1 |
| Travel | 1`941.4 |
| Total 2009 | 29'596.5 |
|---|---|
| Other | 385.8 |
| Financial Services | 992.9 |
| Industry & Wholesaling | 5`021.8 |
| Commerce | 5`869.7 |
| Cooperative Retailing | 15`695.2 |
| Travel | 1`631.1 |
| Total 2010 | 29'646.0 |
|---|---|
| Other | 247.7 |
| Financial Services | 967.4 |
| Industry & Wholesaling | 5`128.8 |
| Commerce | 6`092.9 |
| Cooperative Retailing | 15'704.5 |
| Travel | 1`504.7 |
| Total 2011 | 29'398.8 |
|---|---|
| Other | 189.5 |
| Financial Services | 971.4 |
| Industry & Wholesaling | 5'127.4 |
| Commerce | 6'395.4 |
| Cooperative Retailing | 15'306.4 |
| Travel | 1'408.7 |
EBIT 2008-2011 by business units
[in CHF million]
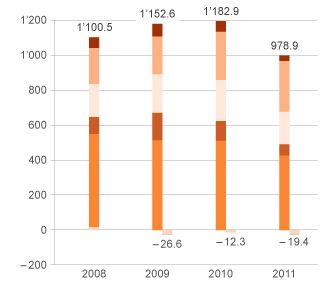
| Total 2008 | 1'100.5 |
|---|---|
| Other | 61.2 |
| Financial Services | 207.5 |
| Industry & Wholesaling | 186.5 |
| Commerce | 98.7 |
| Cooperative Retailing | 532.6 |
| Travel | 14.0 |
| Total 2009 | 1'152.6 |
|---|---|
| Other | 73.3 |
| Financial Services | 216.7 |
| Industry & Wholesaling | 218.1 |
| Commerce | 156.4 |
| Cooperative Retailing | 514.7 |
| Travel | -26.6 |
| Total 2010 | 1'182.9 |
|---|---|
| Other | 60.7 |
| Financial Services | 277.5 |
| Industry & Wholesaling | 232.9 |
| Commerce | 112.3 |
| Cooperative Retailing | 511.8 |
| Travel | -12.3 |
| Total 2011 | 978.9 |
|---|---|
| Other | 29.9 |
| Financial Services | 291.4 |
| Industry & Wholesaling | 185.7 |
| Commerce | 63.4 |
| Cooperative Retailing | 427.9 |
| Travel | -19.4 |
Investments 2008-2011 by business units
[in CHF million]
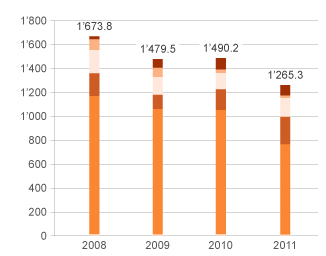
| Total 2008 | 1'673.8 |
|---|---|
| Other | 24.4 |
| Financial Services | 93.4 |
| Industry & Wholesaling | 193.9 |
| Commerce | 189.9 |
| Cooperative Retailing | 1`157 |
| Travel | 15.2 |
| Total 2009 | 1'479.5 |
|---|---|
| Other | 71.1 |
| Financial Services | 76.8 |
| Industry & Wholesaling | 150.7 |
| Commerce | 117.8 |
| Cooperative Retailing | 1`050.7 |
| Travel | 12.4 |
| Total 2010 | 1'490.2 |
|---|---|
| Other | 96.5 |
| Financial Services | 31.5 |
| Industry & Wholesaling | 135.3 |
| Commerce | 171.3 |
| Cooperative Retailing | 1`039.5 |
| Travel | 16.1 |
| Total 2011 | 1'265.3 |
|---|---|
| Other | 87.8 |
| Financial Services | 22.0 |
| Industry & Wholesaling | 156.6 |
| Commerce | 230.0 |
| Cooperative Retailing | 758.8 |
| Travel | 10.1 |
Workforce 2008-2011 by business units
[in thousands]
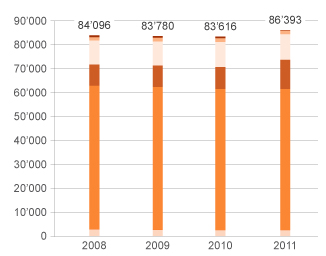
| Total 2008 | 84'096 |
|---|---|
| Other | 768 |
| Financial Services | 1'424 |
| Industry & Wholesaling | 9'955 |
| Commerce | 8'896 |
| Cooperative Retailing | 60'165 |
| Travel | 2'888 |
| Total 2009 | 83'780 |
|---|---|
| Other | 763 |
| Financial Services | 1'493 |
| Industry & Wholesaling | 10'049 |
| Commerce | 9'024 |
| Cooperative Retailing | 59'786 |
| Travel | 2'665 |
| Total 2010 | 83'616 |
|---|---|
| Other | 697 |
| Financial Services | 1'537 |
| Industry & Wholesaling | 10'523 |
| Commerce | 9'235 |
| Cooperative Retailing | 59'057 |
| Travel | 2'567 |
| Total 2011 | 86'393 |
|---|---|
| Other | 122 |
| Financial Services | 1'570 |
| Industry & Wholesaling | 10'679 |
| Commerce | 12'305 |
| Cooperative Retailing | 59'190 |
| Travel | 2'527 |
Migros Group sales
Migros Group sales
| in CHF million | 2011 | 2010 | Change in % |
| Net revenue from goods and services sold by segment | |||
| Cooperative Retailing | |||
| Cooperatives incl. foreign retail sales1 | 14'661.9 | 15'164.2 | –3.3 |
| FCM | 5'222.7 | 5'468.2 | –4.5 |
| Logistics | 330.7 | 329.0 | 0.5 |
| Other companies | 165.3 | 128.1 | 29.0 |
| Commerce | |||
| Denner1 | 2'784.2 | 2'783.7 | 0.0 |
| Migrol1 | 1'766.7 | 1'703.9 | 3.7 |
| Magazine zum Globus1 | 788.1 | 818.1 | –3.7 |
| Depot (Gries Deco Company)1 | 265.3 | n.a. | – |
| Interio1 | 242.7 | 257.3 | –5.7 |
| Ex Libris1 | 168.7 | 190.5 | –11.4 |
| LeShop1 | 149.5 | 151.2 | –1.1 |
| Office World and Others1 | 156.1 | 130.9 | 19.3 |
| Other companies1 tlw | 63.9 | 41.5 | 54.2 |
| Industry & Wholesaling | 5'333.2 | 5'315.8 | 0.3 |
| Travel | 1390.7 | 1'489.3 | –6.6 |
| Financial Services | 3.6 | 3.7 | –2.7 |
| Other | 171.4 | 225.5 | –24.0 |
| Total net revenue from goods and services sold | 33'664.6 | 34'096.9 | –1.3 |
| Elimination of internal Group sales of goods and services | –10'078.6 | –10'391.0 | –3.0 |
| TOTAL NET REVENUE FROM GOODS AND SERVICES SOLD | 23'586.0 | 23'809.7 | –0.9 |
| Income from Financial Services | 965.3 | 960.2 | 0.5 |
| Other operating income | 307.6 | 270.7 | 13.6 |
| Elimination of internal Group income | –0.1 | –0.3 | –66.7 |
| Total income (sales) | 24'858.8 | 25'040.3 | –0.7 |
1 Migros retail sales CHF 21'058.6 million (previous year CHF 21'199.8 million), of which foreign retail sales CHF 486.6 million (previous year CHF 201.3 million).
Market shares
Market shares 2007–2011
| 2007 | 2008 | 2009 | 2010 | 2011 | |
| Market share – Food | 25.0 | 28.6 | 28.1 | 27.3 | 26.7 |
| Market share – Non-Food | 12.4 | 12.9 | 13.0 | 13.0 | 13.1 |
| Market share – Migros Group | 18.3 | 20.6 | 20.4 | 20.1 | 19.9 |
Swiss retail posted falling sales and negative inflation in 2011 (BAKBASEL). In this difficult environment, the market share of the Migros Group developed positively in the non-food area (+0.1%) in a contracting Swiss non-food market (–2.7%) in 2011. In the food area, Migros' price initiative, amongst other things, had a negative impact on its market share performance (–0.6%). Overall, the Migros Group achieved a market share of 19.9%, which represented a slight market share loss of 0.2% on the previous year.
Net revenue from goods and services sold by region
Cooperative Retailing
Earnings
Cooperative Retailing earnings
| in CHF million | 2011 | 2010 | Change in % |
| Net revenue from goods and services sold | |||
| – Cooperatives incl. other countries | 14'661.9 | 15'164.2 | –3.3 |
| – FMC | 5'222.7 | 5'364.4 | –2.6 |
| – Logistics | 330.7 | 329.0 | 0.5 |
| – Other companies | 165.3 | 128.1 | 29.0 |
| Total net revenue from sales of goods and services sold | 20'380.6 | 20'985.7 | –2.9 |
| Other operating income | 172.6 | 162.1 | 6.5 |
| Eliminations | –5'246.8 | –5'464.6 | –4.0 |
| Total income | 15'306.4 | 15'683.2 | –2.4 |
| Earnings before financial income, income tax and pension plan effect (EBIT) | 427.9 | 501.6 | –14.7 |
| Segment assets | 9'087.6 | 8'863.1 | |
| Investments in long-term assets | 758.8 | 1'039.5 | |
| Employees | 59'190 | 59'057 |
Charts of the ten regional Cooperatives
Distribution network
Cooperative Retailing distribution network
| No. of sites 2011 | No. of sites 2010 | Sales area (m2) 2011 | Sales area (m2) 2010 | |
| M DISTRIBUTION SITES SWITZERLAND | ||||
| Migros sites | ||||
| M | 297 | 291 | 225'042 | 214'364 |
| MM | 214 | 213 | 501'973 | 493'526 |
| MMM | 39 | 39 | 322'454 | 325'621 |
| TOTAL | 550 | 543 | 1'049'469 | 1'033'511 |
| MParcs/specialist market centres/Obi | 46 | 44 | 269'392 | 248'815 |
| Single-line stores (bargain basements, etc.) | 23 | 19 | 12'533 | 9'875 |
| TOTAL | 69 | 63 | 281'925 | 258'690 |
| Standalone restaurants | 4 | 4 | 1'003 | 1'003 |
| TOTAL SITES | 623 | 610 | 1'332'397 | 1'293'204 |
| M DISTRIBUTION LINES SWITZERLAND | ||||
| Supermarkets | ||||
| M, MM und MMM | 550 | 543 | 856'731 | 847'189 |
| Other supermarkets1 | 14 | 10 | 16'376 | 12'553 |
| TOTAL SUPERMARKETS | 564 | 553 | 873'107 | 859'742 |
| Specialist markets | ||||
| Do It+Garden | 52 | 50 | 108'589 | 107'793 |
| Micasa | 29 | 28 | 75'553 | 63'447 |
| sportXX | 57 | 53 | 65'729 | 61'492 |
| m-electronics | 68 | 65 | 33'613 | 32'109 |
| Obi DIY superstore/garden | 11 | 10 | 86'754 | 81'295 |
| TOTAL SPECIALIST MARKETS | 217 | 206 | 370'238 | 346'136 |
| Migros catering services | ||||
| M-Restaurants, standalone | 4 | 4 | 1'003 | 1'003 |
| M-Restaurants, in-store | 185 | 185 | 88'049 | 86'323 |
| TOTAL RESTAURANTS | 189 | 189 | 89'052 | 87'326 |
| M DISTRIBUTION SITES OTHER COUNTRIES | ||||
| France (Migros France) | ||||
| MMM | 2 | 2 | 9'947 | 10'069 |
| MM | 1 | 1 | 1'317 | 1'317 |
| Germany (GM Basel) | ||||
| MM | 5 | 4 | 10'163 | 8'931 |
| TOTAL OTHER COUNTRIES | 8 | 7 | 21'427 | 20'317 |
| WHOLESALING - COOPERATIVES AND OTHER | ||||
| Migros Partner | 71 | 75 | ||
| VOI | 13 | 8 | ||
| LEISURE FACILITIES AND FOUNDATIONS | ||||
| Fitnessparks, fitness centres and Wellnessparks2 | 44 | 40 | ||
| Aquaparcs | 3 | 3 | ||
| Sportparcs | 3 | 3 | ||
| Golfparcs | 6 | 6 | ||
| «Green Meadow» Parks Foundation | 4 | 4 |
1 Integral with MParcs or specialist market centers
2 Incl. subsidiaries (Activ Fitness, FlowerPower, One TC)
Commerce
Earnings
Commerce earnings
| in CHF million | 2011 | 2010 | Change in % |
| Net revenue from goods and services sold | |||
| – Denner | 2'784.2 | 2'783.7 | 0.0 |
| – Migrol | 1'766.7 | 1'703.9 | 3.7 |
| – Magazine zum Globus | 788.1 | 818.1 | –3.7 |
| – Depot (Gries Deco Company) | 265.3 | n.a. | – |
| – Interio | 242.7 | 257.3 | –5.7 |
| – Ex Libris | 168.7 | 190.5 | –11.4 |
| – LeShop | 149.5 | 151.2 | –1.1 |
| – Office World | 156.1 | 130.9 | 19.3 |
| – Other companies | 63.9 | 41.5 | 54.2 |
| Total net revenue from sales of goods and services sold | 6'385.2 | 6'077.0 | 5.1 |
| Other operating income | 49.4 | 45.3 | 9.1 |
| Eliminations | –39.2 | –29.4 | 33.3 |
| Total income (sales) | 6'395.4 | 6'092.9 | 5.0 |
| Earnings before financial income, income tax and pension plan effect (EBIT) | 63.4 | 112.3 | –43.5 |
| Segment assets | 2'226.8 | 1'996.4 | |
| Investments in long-term assets | 230.0 | 171.3 | |
| Employees | 12'305 | 9'235 |
Distribution network
Commerce distribution network
| No. of sites 2011 | No. of sites 2010 | Sales area (m2) 2011 | Sales area (m2) 2010 | |
| Denner | 764 | 761 | ||
| Denner stores | 444 | 441 | 172'979 | 170'035 |
| Denner Satellite stores | 320 | 320 | ||
| Globus (Magazine zum Globus AG)1 | 38 | 39 | 96'902 | 96'415 |
| Globus department stores1 | 15 | 15 | 85'086 | 84'444 |
| Herren Globus1 | 23 | 24 | 11'816 | 11'971 |
| Interio (furniture stores and Depot-Interio boutiques) | 34 | 30 | 47'782 | 42'442 |
| Depot (Germany and Austria) | 273 | 181 | 130'277 | 83'865 |
| Office World | 23 | 22 | 15'252 | 14'567 |
| Ex Libris | 113 | 114 | 10'890 | 11'010 |
| MIGROL | ||||
| Filling stations, total | 289 | 295 | ||
| Migrol Auto Service/Migrol Service | 151 | 149 | ||
| Filling stations (automat) | 138 | 146 | ||
| Convenience Stores (migrolino and Migrol Shops) | (139) | (138) | ||
| Convenience Stores | 234 | 225 | ||
| migrolino2 | 174 | 160 | ||
| Migrol-Shops | 60 | 65 |
1 New floor space calculation directives have been in place for Globus department stores and Herren Globus since 2011. The previous year’s values are also stated in accordance with the new floor space calculation directives in the interest of direct comparability.
2 Operated by Migrol, Shell or migrolino AG
Industry & Wholesaling
Earnings
Industry & Wholesaling earnings
| in CHF million | 2011 | 2010 | Change in % |
| Net revenue from goods and services sold | 5'333.2 | 5'315.8 | 0.3 |
| Other operating income | 45.6 | 40.7 | 12.0 |
| Eliminations | –251.4 | –227.7 | 10.4 |
| Total income | 5'127.4 | 5'128.8 | 0.0 |
| Earnings before financial income, income tax and pension plan effect (EBIT) | 185.7 | 232.9 | –20.3 |
| Segment assets | 2'099.0 | 1'985.3 | |
| Investments in long-term assets | 156.6 | 135.3 | |
| Employees | 10'679 | 10'523 |
Charts of Industry & Wholesaling
Financial Services
Earnings
Financial Services earnings
| in CHF million | 2011 | 2010 | Change in % |
| Net revenue from goods and services sold | 3.6 | 3.7 | –2.7 |
| Income from financial services | 965.3 | 960.2 | 0.5 |
| Other operating income | 2.5 | 3.5 | –28.6 |
| Total income | 971.4 | 967.4 | 0.4 |
| Earnings before finance income, income tax and pension plan effect (EBIT) | 291.4 | 277.5 | 5.0 |
| Segment assets | 35'784.7 | 33'663.6 | |
| Investments in long-term assets | 22.0 | 31.5 | |
| Employees | 1'570 | 1'537 |
Travel
Earnings
Travel earnings
| in CHF million | 2011 | 2010 | Change in % |
| Net revenue from goods and services sold | 1'390.7 | 1'489.3 | –6.6 |
| Other operating income | 18 | 15.5 | 16.1 |
| Total income | 1'408.7 | 1'504.7 | –6.4 |
| Earnings before finance income, income tax and pension plan effect (EBIT) | –19.4 | –12.3 | -57.7 |
| Segment assets | 148.9 | 153.1 | |
| Investments in long-term assets | 10.1 | 16.1 | |
| Employees | 2'527 | 2'567 |