Figures and Charts of Collaborators
Human Resource Management
Workforce and staff movements
CHART - MA Personenbestand
CHART - Einstellungsquote
CHART - MA-Personenbestand nach SGF
CHART - Fluktuationsquote
CHART - MA-Einstellungs- und Fluktuationsquote im Vergleich
Staff structure
CHART - MA-Mitarbeitende nach Geschlecht
Employment level
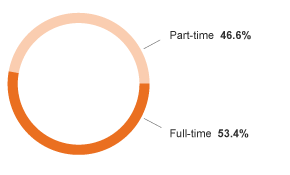
CHART - MA-Voll- und Teilzeitbeschäftigung nach Geschlecht (Migros/Schweiz)
CHART - MA-Teilzeitbeschäftigungsquote
Distribution by age groups
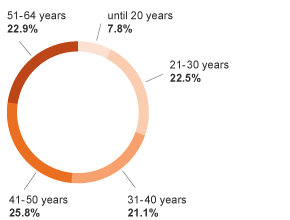
CHART - MA Verteilung nach Geschlecht
CHART - MA-Anteil innerhalb Dienstaltersgruppe nach Geschlecht
CHART - MA-Anteil innerhalb Dienstaltersgruppe nach Geschlecht
CHART - MA Ausländische Mitarbeitende
CHART - MA Mitarbeitende Unternehmen Schweiz/Ausland
Staff expenditure and value added
CHART - MA-Lohnanpassungen
CHART - MA-Personalkostenentwicklung
CHART - MA-Lohnsummenentwicklung
Basis Retail and Industry sector (without Financial Services)CHART - MA-Wertschöpfungsanteil
Health and Safety at Work
Working hours, absence and accidents
CHART - MA-Arbeitsstunden, Urlaube und Absenzen
CHART - MA-Gesundheitsquote
CHART - MA Absenzquote
CHART - MA Wöchentliche Dauer der Absenzen pro Arbeitsstelle
CHART - MA Absenzquote Krankheit, Berufs- und Nichtberufsunfall
Women, Family and Career
Work and gender
CHART - MA-Mitarbeitende nach Geschlecht
Employment level
CHART - MA-Voll- und Teilzeitbeschäftigung nach Geschlecht (Migros/Schweiz)
CHART - MA-Teilzeitbeschäftigungsquote
Distribution by age groups
CHART - MA Verteilung nach Geschlecht
CHART - MA-Anteil innerhalb Dienstaltersgruppe nach Geschlecht
CHART - MA-Anteil innerhalb Dienstaltersgruppe nach Geschlecht
Women in managerial posts
CHART - MA-Frauenanteil in Führungspositionen
Social Partnership/CLA
Participation
Functional position of the members in personnel committees
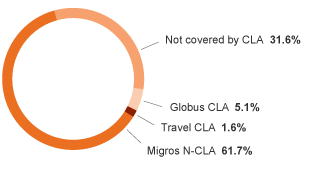
Subordination to CLA
CHART - MA-GAV-Unterstellung im Vergleich Migros/Schweiz
Subordination to collective work agreements in the Migros Group
Vocational Training and Personnel Development
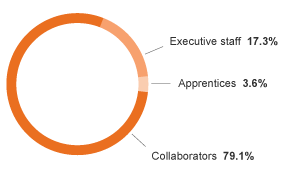
Trainees at Migros
CHART - MA Lernende in der Migros – Entwicklung und Bestand
CHART - MA Lernendenquote
CHART - MA-Berufsbildung in SGF
CHART - MA Berufsbildung Migros-Gruppe
Personnel and leadership development
Training hours during working time in 2012*
| Total hours 2012 | Hours per person | |
| Employees | 552'000 | 6.6 |
| Management staff | 75'200 | 14.4 |
| Total | 627’200 | 7.1 |
* Training by means of e-learning not included