


Figures and Charts
of the Strategic Business Units
Overview Strategic Business Units
Earnings, EBIT, investments and employees 2008–2012
Earnings 2009 - 2013 by business units
[in Mio. CHF]
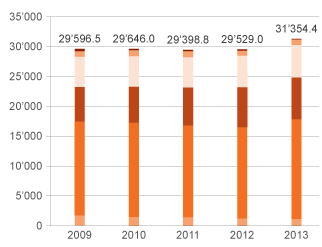
| Total 2009 | 29'596.5 |
|---|---|
| Other | 385.8 |
| Financial services | 992.9 |
| Industry & wholesaling | 5'021.8 |
| Commerce | 5'869.7 |
| Cooperative Retailing | 15'695.2 |
| Travel | 1'631.1 |
| Total 2010 | 29'646.0 |
|---|---|
| Other | 247.7 |
| Financial services | 967.4 |
| Industry & wholesaling | 5'128.8 |
| Commerce | 6'092.9 |
| Cooperative Retailing | 15'704.5 |
| Travel | 1'504.7 |
| Total 2011 | 29'398.8 |
|---|---|
| Other | 189.5 |
| Financial services | 971.4 |
| Industry & wholesaling | 5'127.4 |
| Commerce | 6'395.4 |
| Cooperative Retailing | 15'306.4 |
| Travel | 1'408.7 |
| Total 2012 | 29'529.0 |
|---|---|
| Other | 155.0 |
| Financial services | 927.9 |
| Industry & wholesaling | 5'204.6 |
| Commerce | 6'797.4 |
| Cooperative Retailing | 15'230.0 |
| Travel | 1'214.1 |
| Total 2013 | 31'354.4 |
|---|---|
| Other | 145.5 |
| Financial services | 898.8 |
| Industry & wholesaling | 5'496.0 |
| Commerce | 7'011.4 |
| Cooperative Retailing | 16'662.3 |
| Travel | 1'140.4 |
EBIT 2009 - 2013 by business units
[in Mio. CHF]
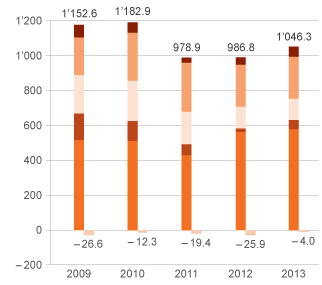
| Total 2009 | 1'152.6 |
|---|---|
| Other | 73.3 |
| Financial services | 216.7 |
| Industry & wholesaling | 218.1 |
| Commerce | 156.4 |
| Cooperative Retailing | 514.7 |
| Travel | -26.6 |
| Total 2010 | 1'182.9 |
|---|---|
| Other | 60.7 |
| Financial services | 277.5 |
| Industry & wholesaling | 232.9 |
| Commerce | 112.3 |
| Cooperative Retailing | 511.8 |
| Travel | -12.3 |
| Total 2011 | 978.9 |
|---|---|
| Other | 29.9 |
| Financial services | 291.4 |
| Industry & wholesaling | 185.7 |
| Commerce | 63.4 |
| Cooperative Retailing | 427.9 |
| Travel | -19.4 |
| Total 2012 | 986.8 |
|---|---|
| Other | 69.6 |
| Financial services | 237.9 |
| Industry & wholesaling | 125.8 |
| Commerce | 13.9 |
| Cooperative Retailing | 565.5 |
| Travel | -25.9 |
| Total 2013 | 1'046.3 |
|---|---|
| Other | 56.8 |
| Financial services | 240.9 |
| Industry & wholesaling | 122.3 |
| Commerce | 50.4 |
| Cooperative Retailing | 579.9 |
| Travel | -4.0 |
Investments 2009 - 2013 by business units
[in Mio. CHF]
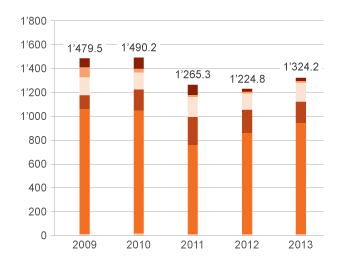
| Total 2009 | 1'479.5 |
|---|---|
| Other | 71.1 |
| Financial services | 76.8 |
| Industry & wholesaling | 150.7 |
| Commerce | 117.8 |
| Cooperative Retailing | 1'050.7 |
| Travel | 12.4 |
| Total 2010 | 1'490.2 |
|---|---|
| Other | 96.5 |
| Financial services | 31.5 |
| Industry & wholesaling | 135.3 |
| Commerce | 171.3 |
| Cooperative Retailing | 1'039.5 |
| Travel | 16.1 |
| Total 2011 | 1'265.3 |
|---|---|
| Other | 87.8 |
| Financial services | 22.0 |
| Industry & wholesaling | 156.6 |
| Commerce | 230.0 |
| Cooperative Retailing | 758.8 |
| Travel | 10.1 |
| Total 2012 | 1'224.8 |
|---|---|
| Other | 20.5 |
| Financial services | 13.3 |
| Industry & wholesaling | 127.6 |
| Commerce | 193.9 |
| Cooperative Retailing | 859.2 |
| Travel | 10.3 |
| Total 2013 | 1'324.2 |
|---|---|
| Other | 22.4 |
| Financial services | 16.9 |
| Industry & wholesaling | 163.5 |
| Commerce | 174.4 |
| Cooperative Retailing | 941.8 |
| Travel | 5.2 |
Workforce 2009 - 2013 by business units
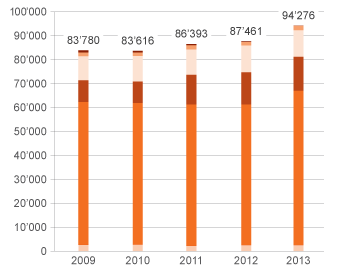
| Total 2009 | 83'780 |
|---|---|
| Other | 763 |
| Financial services | 1'493 |
| Industry & wholesaling | 10'049 |
| Commerce | 9'024 |
| Cooperative Retailing | 59'786 |
| Travel | 2'665 |
| Total 2010 | 83'616 |
|---|---|
| Other | 697 |
| Financial services | 1'537 |
| Industry & wholesaling | 10'523 |
| Commerce | 9'235 |
| Cooperative Retailing | 59'057 |
| Travel | 2'567 |
| Total 2011 | 86'393 |
|---|---|
| Other | 122 |
| Financial services | 1'570 |
| Industry & wholesaling | 10'679 |
| Commerce | 12'305 |
| Cooperative Retailing | 59'190 |
| Travel | 2'527 |
| Total 2012 | 87'461 |
|---|---|
| Other | 122 |
| Financial services | 1'585 |
| Industry & wholesaling | 11'079 |
| Commerce | 13'483 |
| Cooperative Retailing | 58'833 |
| Travel | 2'359 |
| Total 2013 | 94'276 |
|---|---|
| Other | 130 |
| Financial services | 1'552 |
| Industry & wholesaling | 11'284 |
| Commerce | 14'165 |
| Cooperative Retailing | 64'579 |
| Travel | 2'566 |
Migros Group sales
Migros Group sales
Migros Group sales
| in CHF million | 2013 | 2012 | Change in % |
| Net revenue from goods and services sold by segment | |||
| Cooperative Retailing | |||
| Cooperatives incl. foreign retail sales1 | 15'844.3 | 14'524.0 | 9.12 |
| FCM | 5'186.1 | 5'147.5 | 0.7 |
| Logistics | 332.5 | 334.4 | –0.6 |
| Other companies | 204.9 | 185.4 | 10.5 |
| Commerce | |||
| Denner1 | 2'873.2 | 2'832.8 | 1.4 |
| Migrol1 | 1'863.4 | 1'881.6 | –1.0 |
| Magazine zum Globus1 | 797.5 | 778.9 | 2.4 |
| Depot (Gries Deco Group)1 | 422.1 | 332.7 | 26.9 |
| migrolino1 | 301.6 | 224.3 | 34.5 |
| Office World Group1 | 175.8 | 160.2 | 9.7 |
| Interio1 | 170.4 | 196.1 | –13.13 |
| Le Shop1 | 158.1 | 149.5 | 5.8 |
| Ex Libris1 | 141.9 | 153.8 | –7.7 |
| Other companies1 | 77.6 | 59.3 | 30.9 |
| Industry & Wholesaling | 5'763.5 | 5'419.8 | 6.3 |
| Travel | 1'130.4 | 1'203.2 | –6.1 |
| Financial Services | 3.4 | 3.7 | –8.1 |
| Other | 126.2 | 123.8 | 1.9 |
| Total net revenue from goods and services sold | 35'572.9 | 33'711.0 | 5.5 |
| Elimination of internal Group sales of goods and services | –10'037.7 | –9'912.1 | 1.3 |
| TOTAL NET REVENUE FROM GOODS AND SERVICES SOLD | 25'535.2 | 23'798.9 | 7.3 |
| Income from Financial Services | 891.1 | 921.9 | –3.3 |
| Other operating income | 310.7 | 278.0 | 11.8 |
| Elimination of internal Group income | – | – | – |
| Total income (sales) | 26'737.0 | 24'998.8 | 7.0 |
1 Migros retail sales CHF 22'867.1 million (previous year CHF 21'333.9 million), of which foreign retail sales CHF 1'835.5 million (previous year CHF 568.7 million).
2 The tegut... Group, with a share of sales of CHF 1'201.1 million, is included in the foreign Cooperatives for the first time in 2013.
3 Sales decline at Interio due primarily to the transfer of DEPOT homeware stores and boutiques to Depot Schweiz AG as of 01 July 2012; adjusted sales decline –4.5%.
Net revenue from goods and services sold by region
Cooperative Retailing
Earnings
Cooperative Retailing earnings
| in CHF million | 2013 | 2012 | Change in % |
| Net revenue from goods and services sold | |||
| Cooperatives incl. other countries | 15'844.3 | 14'524.0 | 9.11 |
| FMC | 5'186.1 | 5'147.5 | 0.7 |
| Logistics | 332.5 | 334.4 | –0.6 |
| Other companies | 204.9 | 185.4 | 10.5 |
| Total net revenue from sales of goods and services sold | 21'567.8 | 20'191.3 | 6.8 |
| Other operating income | 175.9 | 156.0 | 12.8 |
| Eliminations | –5'081.4 | –5'117.3 | –0.7 |
| Total income | 16'662.3 | 15'230.0 | 9.4 |
| Earnings before financial income, income tax and pension plan effect (EBIT) | 579.9 | 565.5 | 2.5 |
| Segment assets | 9'434.7 | 9'174.5 | |
| Investments in long-term assets | 941.8 | 859.2 | |
| Employees | 64'579 | 58'833 |
1 Sales growth due primarily to the inclusion of the tegut... Group for the first time (CHF 1'201.1 million).
Charts of the ten regional Cooperatives
Distribution network
Cooperative Retailing distribution network
| Number of sites 2013 | Number of sites 2012 | Sales area (m2) 2013 | Sales area (m2) 2012 | |
| DISTRIBUTION SITES SWITZERLAND | ||||
| Migros sites | ||||
| M | 306 | 305 | 240'211 | 237'758 |
| MM | 212 | 211 | 497'185 | 497'621 |
| MMM | 43 | 40 | 343'734 | 325'294 |
| TOTAL | 561 | 556 | 1'081'130 | 1'060'673 |
| MParcs/specialist market centres/Obi | 43 | 46 | 249'309 | 270'231 |
| Single-line stores1 | 29 | 24 | 16'621 | 12'313 |
| TOTAL | 72 | 70 | 265'930 | 282'544 |
| Standalone restaurants | 6 | 5 | 1'604 | 1'521 |
| TOTAL SITES | 639 | 631 | 1'348'664 | 1'344'738 |
| DISTRIBUTION LINES SWITZERLAND | ||||
| Supermarkets | ||||
| M, MM and MMM | 561 | 556 | 885'353 | 866'450 |
| Other supermarkets2 | 11 | 13 | 13'033 | 17'818 |
| TOTAL SUPERMARKETS | 572 | 569 | 898'386 | 884'268 |
| Specialist markets | ||||
| Do It+Garden | 48 | 52 | 105'602 | 105'692 |
| Micasa | 27 | 29 | 72'488 | 77'875 |
| sportXX | 54 | 57 | 64'877 | 65'099 |
| m-electronics | 72 | 72 | 35'644 | 34'694 |
| Obi DIY superstore/garden | 10 | 11 | 80'107 | 86'762 |
| TOTAL SPECIALIST MARKETS | 211 | 221 | 358'718 | 370'122 |
| Migros catering services | ||||
| M-Restaurants, standalone | 6 | 5 | 1'604 | 1'521 |
| M-Restaurants, in-store | 186 | 186 | 89'956 | 88'827 |
| TOTAL RESTAURANTS | 192 | 191 | 91'560 | 90'348 |
DISTRIBUTION SITES OTHER COUNTRIES | ||||
| France (Migros France) | ||||
| MMM | 2 | 2 | 9'947 | 9'947 |
| MM | 1 | 1 | 1'317 | 1'317 |
| Germany | ||||
| MM (Migros Basel) | -- | 4 | -- | 8'445 |
| tegut... (Migros Zurich) | 280 | -- | 294'923 | -- |
| TOTAL OTHER COUNTRIES | 283 | 7 | 306'187 | 19'709 |
| WHOLESALING - COOPERATIVES AND OTHER | ||||
| Migros Partner | 62 | 69 | ||
| VOI | 19 | 16 | ||
| LEISURE, HEALTH AND FOUNDATIONS | ||||
| Fitness-/Wellnessparks3 | 63 | 51 | ||
| Medbase health centres | 12 | 12 | ||
| Aquaparcs | 3 | 3 | ||
| Sportparcs | 3 | 3 | ||
| Golfparcs | 8 | 8 | ||
| «Green Meadow» Parks Foundation | 4 | 4 |
1 Alnatura Bio-Supermarkets, Outlets etc.
2 Integral with MParcs or specialist market centers.
3 Incl. subsidiaries (Activ Fitness, FlowerPower, One TC, MFIT, Elements Deutschland)
Commerce
Earnings
Commerce earnings
| in CHF million | 2013 | 2012 | Change in % |
| Net revenue from goods and services sold | |||
| Denner | 2'873.2 | 2'832.8 | 1.4 |
| Migrol | 1'863.4 | 1'881.6 | –1.0 |
| Magazine zum Globus | 797.5 | 778.9 | 2.4 |
| Depot (Gries Deco Group) | 422.1 | 332.7 | 26.9 |
| migrolino | 301.6 | 224.3 | 34.5 |
| Office World Group | 175.8 | 160.2 | 9.7 |
| Interio | 170.4 | 196.1 | –13.11 |
| LeShop | 158.1 | 149.5 | 5.8 |
| Ex Libris | 141.9 | 153.8 | –7.7 |
| Probikeshop | 32.6 | 22.4 | 45.5 |
| Other companies | 45.0 | 36.9 | 22.0 |
| Total net revenue from sales of goods and services sold | 6'981.6 | 6'769.2 | 3.1 |
| Other operating income | 56.0 | 52.7 | 6.3 |
| Eliminations | –26.2 | –24.5 | 6.9 |
| Total income (sales) | 7'011.4 | 6'797.4 | 3.1 |
| Earnings before financial income, income tax and pension plan effect (EBIT) | 50.4 | 13.9 | 262.6 |
| Segment assets | 2'392.0 | 2'344.6 | |
| Investments in long-term assets | 174.4 | 193.9 | |
| Employees | 14'165 | 13'483 |
1 Sales decline at Interio due primarily to the transfer of DEPOT homeware stores and boutiques to Depot Schweiz AG as of 1 July 2012; adjusted sales decline -4.5%.
Distribution network
Commerce distribution network
| Number of sites 2013 | Number of sites 2012 | Sales area (m2) 2013 | Sales area (m2) 2012 | |
| Denner | 791 | 788 | ||
| Denner stores | 466 | 465 | 185'420 | 183'370 |
| Denner Satellite stores (included Denner Express) | 325 | 323 | ||
| Globus (Magazine zum Globus AG) | 40 | 38 | 98'178 | 97'508 |
| Globus department stores | 15 | 15 | 84'971 | 85'106 |
| Herren Globus | 25 | 23 | 13'207 | 12'402 |
| Interio (furniture stores) | 11 | 10 | 43'115 | 39'053 |
| Depot Switzerland | 29 | 25 | 16'688 | 15'258 |
| Depot (Germany and Austria) | 391 | 356 | 191'808 | 168'963 |
| Office World | 24 | 24 | 15'969 | 15'969 |
| Ex Libris | 88 | 107 | 8'870 | 10'450 |
| MIGROL | ||||
| Filling stations, total | 308 | 287 | ||
| Migrol Auto Service/Migrol Service | 146 | 150 | ||
| Filling stations (automat) | 162 | 137 | ||
| Convenience Stores (migrolino and Migrol Shops) | (145) | (142) | ||
| Convenience Stores | 301 | 252 | ||
| migrolino1 | 243 | 194 | ||
| Migrol-Shops | 58 | 58 |
1 These locations are divided into migrolino standalone, migrolino Migrol, migrolino Shell and migrolino Socar.
Industry & Wholesaling
Earnings
Industry & Wholesaling earnings
| in CHF million | 2013 | 2012 | Change in % |
| Net revenue from goods and services sold | 5'763.5 | 5'419.8 | 6.3 |
| Other operating income | 45.2 | 46.5 | –2.8 |
| Eliminations | –312.7 | –261.7 | 19.5 |
| Total income | 5'496.0 | 5'204.6 | 5.6 |
| Earnings before financial income, income tax and pension plan effect (EBIT) | 122.3 | 125.8 | –2.8 |
| Segment assets | 2'235.9 | 2'217.8 | |
| Investments in long-term assets | 163.5 | 127.6 | |
| Employees | 11'284 | 11'079 |
Charts of Industry & Wholesaling
Financial Services
Earnings
Financial Services earnings
| in CHF million | 2013 | 2012 | Change in % |
| Net revenue from goods and services sold | 3.4 | 3.7 | –8.1 |
| Income from financial services | 891.1 | 921.9 | –3.3 |
| Other operating income | 4.3 | 2.3 | 87.0 |
| Total income | 898.8 | 927.9 | –3.1 |
| Earnings before financial income, income tax and pension plan effect (EBIT) | 240.9 | 237.9 | 1.3 |
| Segment assets | 38'851.8 | 37'765.9 | |
| Investments in long-term assets | 16.9 | 13.3 | |
| Employees | 1'552 | 1'585 |
Travel
Earnings
Travel earnings
| in CHF million | 2013 | 2012 | Change in % |
| Net revenue from goods and services sold | 1'130.4 | 1'203.2 | –6.1 |
| Other operating income | 10.0 | 10.9 | –8.3 |
| Total income | 1'140.4 | 1'214.1 | –6.1 |
| Earnings before financial income, income tax and pension plan effect (EBIT) | –4.0 | –25.9 | 84.6 |
| Segment assets | 197.7 | 137.6 | |
| Investments in long-term assets | 5.2 | 10.3 | |
| Employees | 2'566 | 2'359 |