Personnel figures
The Migros Group generated record sales in 2023, due in no small part to the dedication of its employees.
Workforce
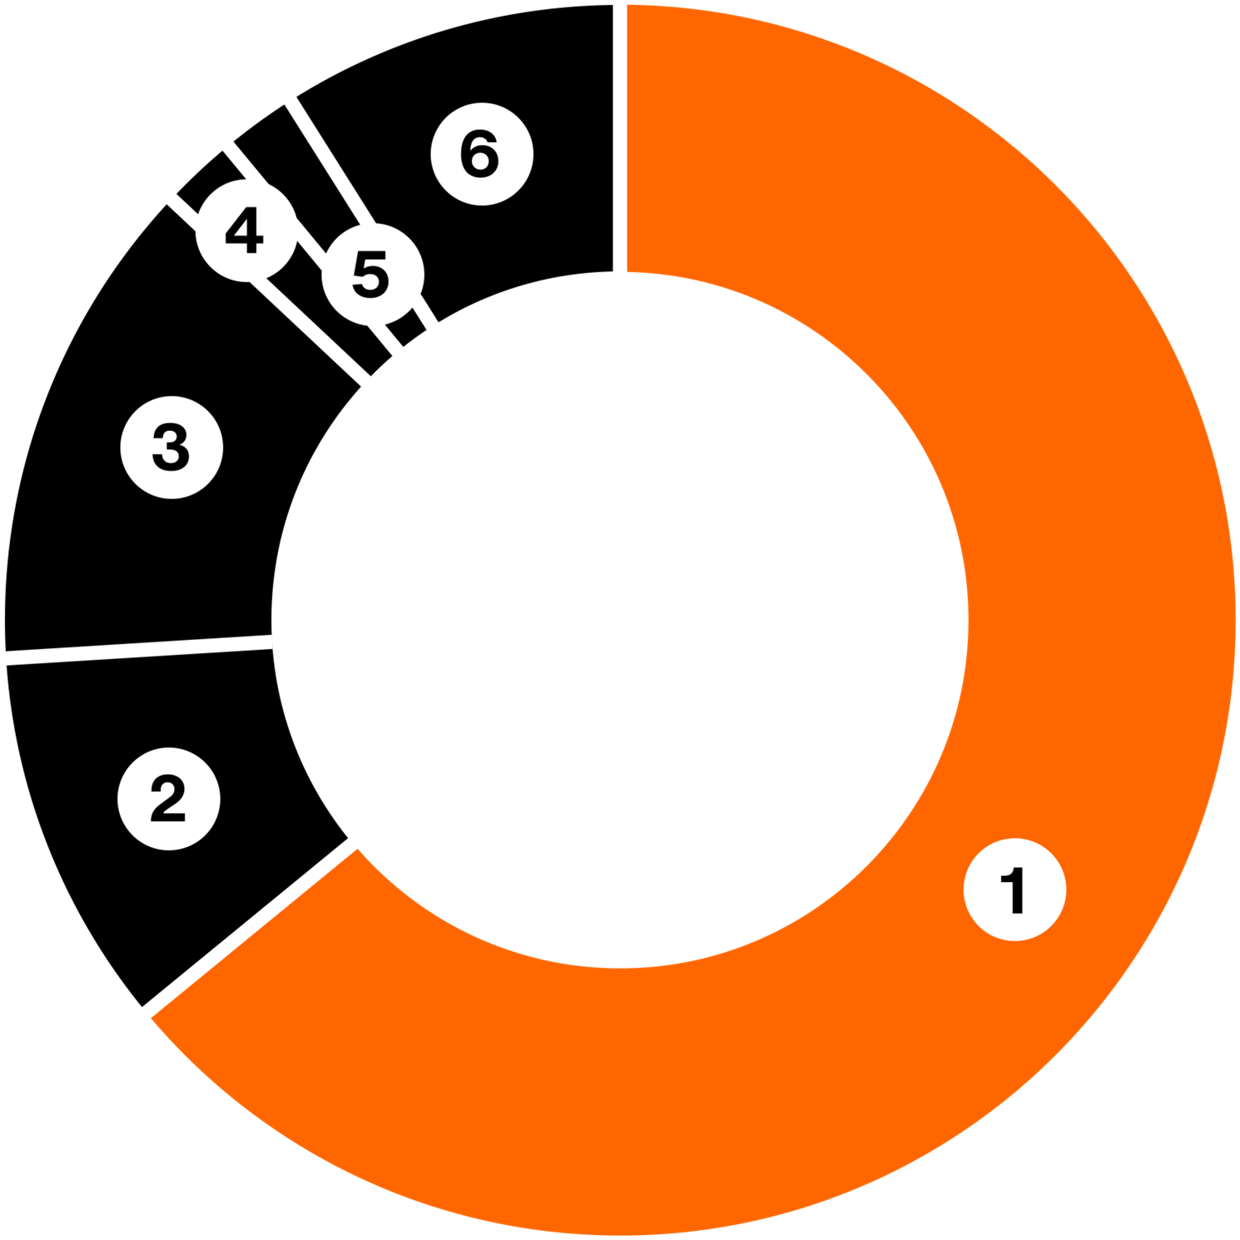
Employees by
strategic business units
1 Coop. Retailing: 63’314
2 Commerce: 9’473
3 Migros Industrie: 13’225
4 Financial Services: 1’958
5 Travel: 2’345
6 Others: 8’860
In 2023, the Migros Group employed an average of 99’175 people in around 90 companies and remains the largest private employer in Switzerland. The number of employees was up slightly by 1.5 % compared with the previous year. Personnel units increased by 2.3 % to 72’523.
The strongest growth was recorded in the Travel (+10.8 %), Financial Services (+7.4 %), Health (+6.9 %) and Commerce segments (+5.3 %). At 88 %, the proportion of employees in Switzerland remained unchanged.
The proportion of women overall also remained constant at 58 %, although it was higher in the Travel (68 %) and Health (76 %) sectors than in Industry (35 %) and Financial Services (48 %). Of the 87’197 employees in Switzerland, about half worked part time, 79 % were paid a monthly salary and 74 % were covered by a collective labour agreement. The average age was 40.5 years (2022: 40.8 years; 2021: 41.5 years), whereby 27 % were under 30, 45 % were aged 31–50 and 28 % were over 50.
For employees paid a monthly salary, the gross fluctuation rate was 20.7 % (13’684 departures), of which 3.9 % were internal transfers within Migros (2’571 departures) and 2.8 % natural staff turnover (1’838 departures). With an average length of service of 10.0 years (2022: 10.6 years; 2021: 10.8 years), employee retention remains exceptionally high.
Key figures Workforce
|
|
Number of employees |
Number of full time equivalent 1 |
Proportion of women 1 |
Proportion of employees from Switzerland 2 |
||||||||
|
|
2021 |
2022 |
2023 |
2021 |
2022 |
2023 |
2021 |
2022 |
2023 |
2021 |
2022 |
2023 |
|
Total |
97’541 |
97’727 |
99’175 |
70’276 |
70’880 |
72’523 |
58.6 % |
58.5 % |
57.8 % |
87.8 % |
87.9 % |
87.9 % |
|
Cooperative Retailing* |
65’195 |
63’179 |
63’314 |
44’243 |
43’731 |
44’042 |
61.4 % |
60.8 % |
59.5 % |
86.4 % |
86.3 % |
86.2 % |
|
Commerce** |
9’210 |
8’998 |
9’473 |
7’315 |
7’325 |
7’811 |
59.9 % |
60.5 % |
60.4 % |
95.9 % |
94.9 % |
94.3 % |
|
Migros Industrie |
13’119 |
13’321 |
13’225 |
12’319 |
12’545 |
12’465 |
34.9 % |
35.4 % |
35.3 % |
89.4 % |
87.6 % |
88.9 % |
|
Financial Services |
1’722 |
1’823 |
1’958 |
1’546 |
1’625 |
1’746 |
48.9 % |
47.7 % |
47.6 % |
100.0 % |
100.0 % |
100.0 % |
|
Travel |
1’900 |
2’117 |
2’345 |
1’677 |
1’892 |
2’126 |
70.0 % |
67.8 % |
68.1 % |
51.5 % |
48.5 % |
46.2 % |
|
Other*** |
6’394 |
8’289 |
8’860 |
3’176 |
3’761 |
4’333 |
76.0 % |
76.3 % |
76.1 % |
94.9 % |
100.0 % |
100.0 % |
Average of monthly figures for calendar year. The base population is all employees of the consolidated Migros Group companies in Switzerland and abroad.
* Retroactive changes: Integration of three companies from the strategic business unit Commerce (2021 and 2022) and transfer of employees to the strategic business unit Other (2022).
** Retroactive changes: Transfer of three companies to the strategic business unit Cooperative Retailing (2021 and 2022).
*** The segment “Other” comprises supporting activities that do not constitute strategic business units in their own right. The segment “Other” includes companies such as the Medbase Group, movemi AG and MiSenso AG. Retroactive change: Integration of employees from the strategic business unit Cooperative Retailing (2022).
1 versus proportion of men
2 versus proportion of employees abroad
|
|
Proportion covered by CLA Switzerland 1 |
Number of appretices Switzerland 2 |
Proportion of apprentices Switzerland 2 |
||||
|
|
2021 |
2022 |
2023 |
2022 |
2023 |
2022 |
2023 |
|
Total |
45’855 |
47’616 |
49’503 |
3’754 |
3’670 |
4.4 % |
4.2 % |
|
Cooperative Retailing |
33’678 |
34’499 |
35’435 |
2’506 |
2’421 |
4.6 % |
4.4 % |
|
Commerce |
534 |
543 |
551 |
172 |
184 |
2.0 % |
2.1 % |
|
Migros Industrie |
10’015 |
10’180 |
10’238 |
501 |
468 |
4.3 % |
4.0 % |
|
Financial Services |
926 |
944 |
991 |
66 |
73 |
3.6 % |
3.7 % |
|
Travel |
534 |
580 |
642 |
66 |
58 |
6.4 % |
5.4 % |
|
Other |
167 |
870 |
1’646 |
443 |
465 |
5.3 % |
5.3 % |
Average of monthly figures for calendar year.
1 CLA = Collective Labour Agreement. The base population is 89 % (N = 60’102) of employees in Switzerland for 2021, 92 % (N = 62’548) for 2022 and 96 % (N = 66’602) for 2023, excluding employees with a management contract or those with an employment level of below 20 % who are paid by the hour.
2 The base population is all employees in Switzerland (2022: N = 85’855; 2023: N = 87’197)
|
|
Proportion of age groups |
||||||||
|
|
2021 |
2022 |
2023 |
||||||
|
|
Up to 30 |
31–50 |
> 50 |
Up to 30 |
31–50 |
> 50 |
Up to 30 |
31–50 |
> 50 |
|
Total |
26.7 % |
45.1 % |
28.1 % |
26.3 % |
45.5 % |
28.1 % |
27.1 % |
45.4 % |
27.6 % |
|
Cooperative Retailing |
27.0 % |
43.3 % |
29.6 % |
27.0 % |
43.2 % |
29.8 % |
27.4 % |
43.2 % |
29.4 % |
|
Commerce |
38.5 % |
44.9 % |
16.6 % |
35.7 % |
47.9 % |
16.3 % |
34.1 % |
49.6 % |
16.3 % |
|
Migros Industrie |
18.9 % |
50.3 % |
30.8 % |
18.7 % |
50.9 % |
30.4 % |
18.7 % |
50.7 % |
30.6 % |
|
Financial Services |
28.2 % |
47.8 % |
23.9 % |
27.8 % |
48.6 % |
23.6 % |
29.3 % |
47.3 % |
23.4 % |
|
Travel |
31.4 % |
46.1 % |
22.5 % |
28.0 % |
46.5 % |
25.4 % |
28.8 % |
45.7 % |
25.5 % |
|
Other |
22.3 % |
57.2 % |
20.5 % |
23.5 % |
54.3 % |
22.2 % |
29.7 % |
48.4 % |
21.9 % |
Average of monthly figures for calendar year. The base population is 91 % (N = 78’239) of all employees in Switzerland for 2021, 93 % (N = 80’167) for 2022 and 97 % (N = 84’385) for 2023.
|
|
Proportion of full-time employees Switzerland 1 |
Proportion of employees on monthly salary Switzerland 2 |
||||
|
|
2021 |
2022 |
2023 |
2021 |
2022 |
2023 |
|
Total |
50.7 % |
50.9 % |
50.9 % |
75.8 % |
77.0 % |
78.8 % |
|
Cooperative Retailing |
46.7 % |
48.0 % |
48.1 % |
73.3 % |
75.5 % |
76.2 % |
|
Commerce |
43.0 % |
45.1 % |
45.7 % |
75.7 % |
83.3 % |
89.8 % |
|
Migros Industrie |
82.5 % |
82.6 % |
82.7 % |
98.0 % |
98.2 % |
98.4 % |
|
Financial Services |
66.0 % |
64.0 % |
64.0 % |
100.0 % |
100.0 % |
100.0 % |
|
Travel |
63.4 % |
63.6 % |
60.3 % |
99.8 % |
99.4 % |
99.9 % |
|
Other |
8.9 % |
11.0 % |
26.6 % |
16.9 % |
24.6 % |
52.0 % |
Average of monthly figures for calendar year.
1 versus part-time employees. The base population is 91 % (N = 78’231) of all employees in Switzerland for 2021, 93 % (N = 80’163) for 2022 and 97 % (N = 84’424) for 2023.
2 versus employees paid by the hour. The populations are 91 % (N = 78’231) of all employees in Switzerland for 2021, 93 % (N = 80’166) for 2022 and 97 % (N = 84’022) for 2023.
|
|
Gross fluctuation Switzerland 1 |
Net fluctuation Switzerland 2 |
||||
|
|
2021 |
2022 |
2023 |
2021 |
2022 |
2023 |
|
Total |
16.8 % |
20.0 % |
20.7 % |
11.5 % |
14.1 % |
14.0 % |
|
Cooperative Retailing |
14.4 % |
19.0 % |
19.8 % |
11.0 % |
13.4 % |
13.9 % |
|
Commerce |
16.5 % |
21.6 % |
23.7 % |
14.0 % |
19.4 % |
21.9 % |
|
Migros Industrie |
25.6 % |
19.8 % |
27.8 % |
11.7 % |
12.6 % |
12.6 % |
|
Financial Services |
13.4 % |
15.3 % |
14.3 % |
11.3 % |
13.4 % |
12.7 % |
|
Travel |
21.2 % |
20.0 % |
17.7 % |
12.3 % |
13.5 % |
11.0 % |
|
Other |
20.6 % |
50.9 % |
10.0 % |
17.6 % |
28.7 % |
9.3 % |
The total number of departures over the calendar year in relation to the average of the monthly employee numbers over the calendar year. The base population is all employees paid by the hour in Switzerland (2021 = 59’289, 2022 = 60’665 and 2023 = 66’183)
1 The gross fluctuation rate includes all departures including natural (retirement, death, temporary employment contract), involuntary (initiated by employer) and voluntary (initiated by employee), and internal transfers within Migros.
2 The gross fluctuation rate does not include natural departures (statutory retirement, temporary employment contract and death) and internal departures within Migros.
Compensation
In 2023, personnel costs increased by 3.8 % to CHF 6’328 million. In nominal terms, the wages paid by Migros companies subject to the Collective Labour Agreement (N-CLA) rose by 2.1 % on average.
The wage increases at Migros were therefore slightly higher than for the Swiss retail sector as a whole, where wages rose by 2.0 % in 2023.1 Some Migros companies also gave employees a one-off bonus in the form of goods vouchers. This demonstrates Migros’ commitment to fair remuneration for its employees.
In addition, Migros decided to increase the minimum and reference wages of employees covered by N-CLA to CHF 4’200 by 2024. This measure underscores Migros’ ongoing commitment to responsible working conditions.
1 According to UBS Compensation SurveyEmployee pension plans
The Migros Pension Fund (MPF) is responsible for the occupational pensions for its members in 37 associated companies of the Migros Group. In 2023, it looked after some 50’800 members and 29’700 pensioners. In 2023, the MPF generated a net return of 3.7 % on its capital investments of CHF 28.2 billion.
The coverage ratio increased to 129.4 % at the end of 2023. The pension capital was calculated with a technical interest rate of 2.0 % (previous year: 1.5 %) on the basis of the BVG 2020 base tables, using the generational concept for mortality assumptions. The MPF pursues a sustainable investment policy and supports the targets of the Paris Agreement. The pension scheme was switched from a defined benefit to a defined contribution plan on 1 January 2023. The above-average benefits were retained.